Attach Multi Timeframe Signal Workshop to a MetaTrader chart and tell it what you want to watch. It is an indicator for traders who want their own conditions checked across timeframes: an H4 RSI below a threshold, price above the daily EMA 200, a recent cross, a visit to a support zone. Build the rule by clicking conditions together, or write it in a text file. The workshop marks the bars where it fires, draws what it read and can alert you. It does not place or manage trades.
I already built the free Multi Timeframe Indicator Suite for putting the measurements on one chart. This is the paid sibling for turning those measurements into conditions you can name, inspect, save and change. There are 36 ready-made signals to start from, but you are not buying a sealed box whose entire explanation is a green arrow and “trust me, bro”.
First stop: a chart and one working signal
Install the Market version for your terminal, then drag MTF Signal Workshop from the Navigator onto a chart. The panel opens with + Signal, Settings and Help. Fold it when you want it out of the way, or move it by its title bar. You do not need a separate collection of indicators installed underneath it.
Start with + Signal, then Load from file. Typing filters the ready-made files. Pick RSI dip in uptrend, read its conditions and click Save. Its historical firings, if any match the available history, appear along with the indicators it uses. Each signal row has On/Off, an edit pencil and removal. Switching one off does not mean deleting the file you might want tomorrow.
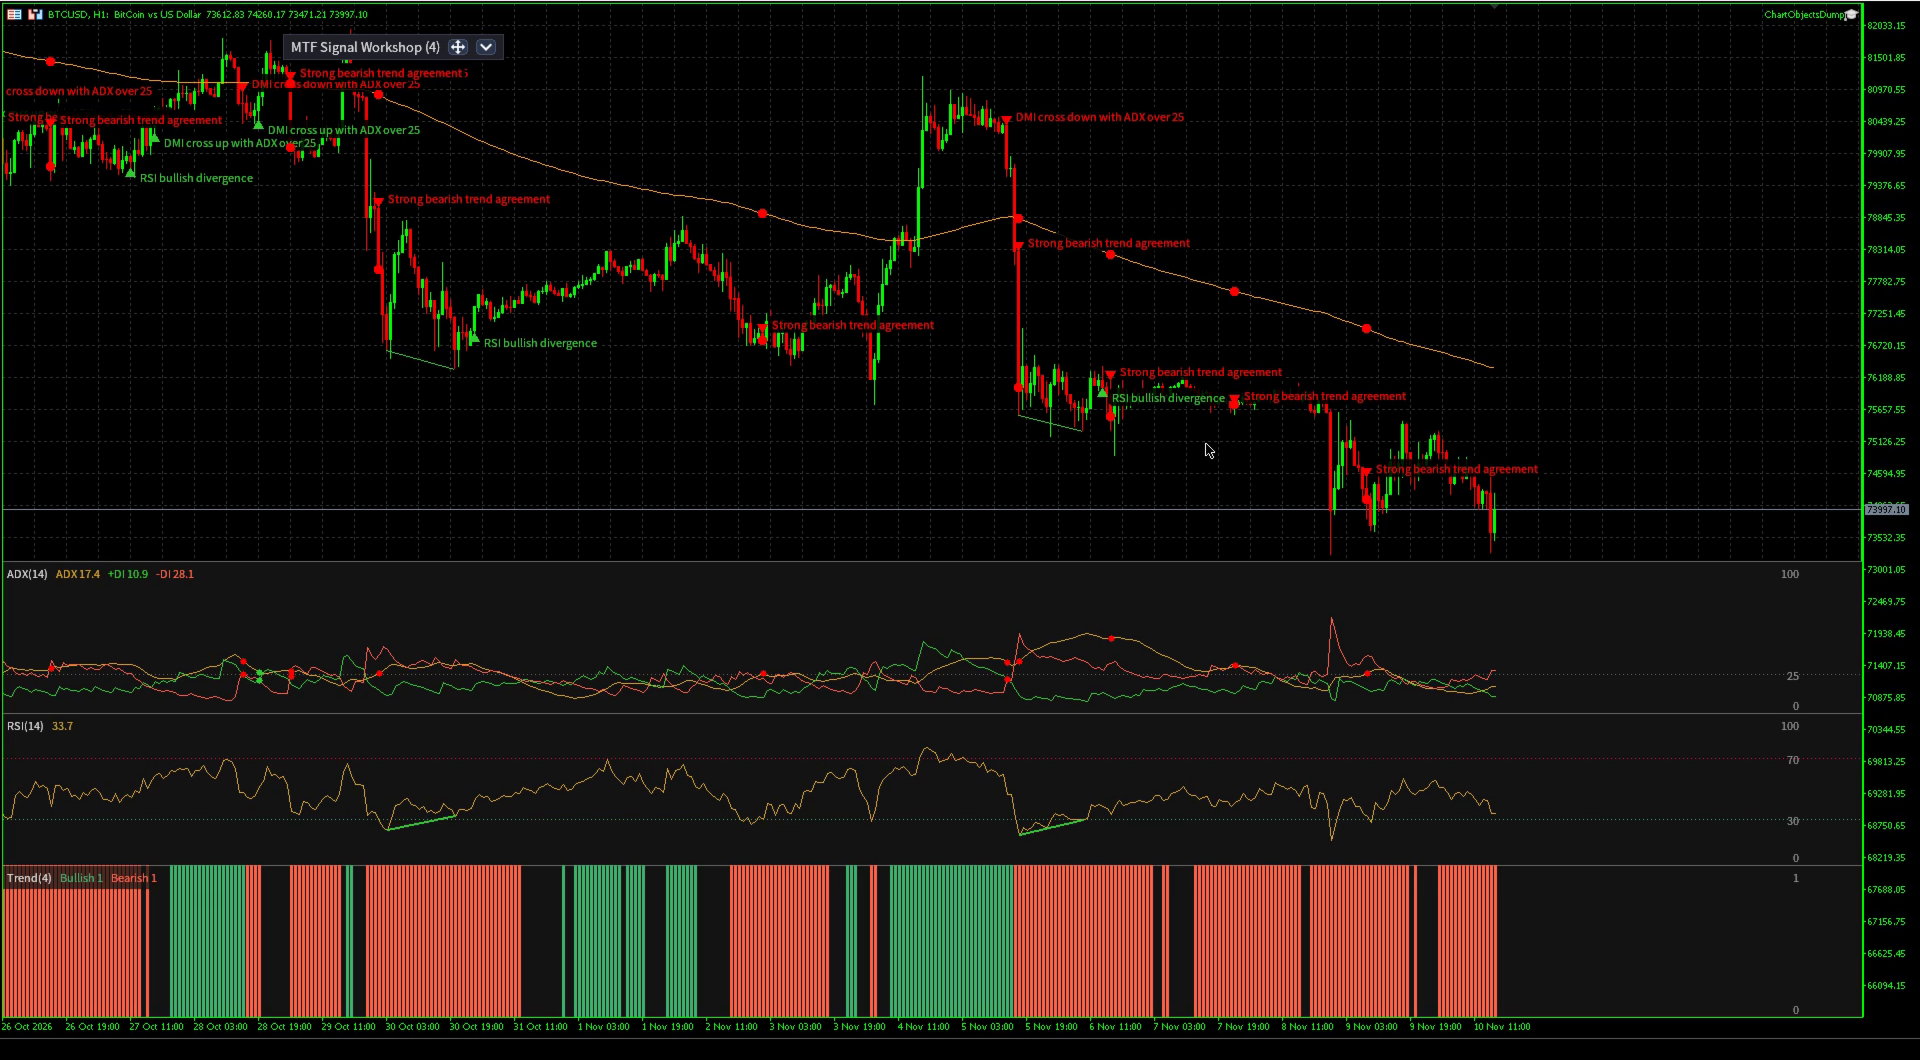
The supplied files cover oscillator and band setups, trend agreement, support and resistance, supply and demand, Fibonacci and smart money concepts. That includes RSI pullbacks, directional-movement crosses, quad stochastic extremes, squeezes, retests, order blocks, fair value gaps and breaks of structure. Most have bullish and bearish counterparts. They are editable examples, not 36 promises that the next candle owes you money.
Each supplied file names its setup’s source in a comment. The workshop writes those files on first use, but does not overwrite one you changed or resurrect one you deleted. There is a difference between shipping useful defaults and periodically shitting all over somebody’s custom work.
Build the rule you actually meant
Take a specific request: a 21-period RSI under 35 on H4, while the daily close stays above its EMA 200. Click + Signal, give it a name and choose a bullish marker. Under + Add condition, choose H4, RSI, period 21, Oversold, level 35. Leave it required to be true now. Add another condition for D1, EMA 200, price above. Keep the group’s header at All of these.
The condition editor puts an indicator’s settings directly under its name. You are changing the RSI period, not just changing the threshold that gets tested afterwards. The Reads line spells out the condition, and Rule text shows what the cards produce:
H4.rsi(21).is_oversold(35)
and D1.ema200.is_above
That is the entire rule. No MQL project, no compile button, no expert advisor whose job is to compare two numbers. Click Save and the signal belongs to the chart. Use Save to file as well if it should be reusable elsewhere; those two buttons do different jobs.
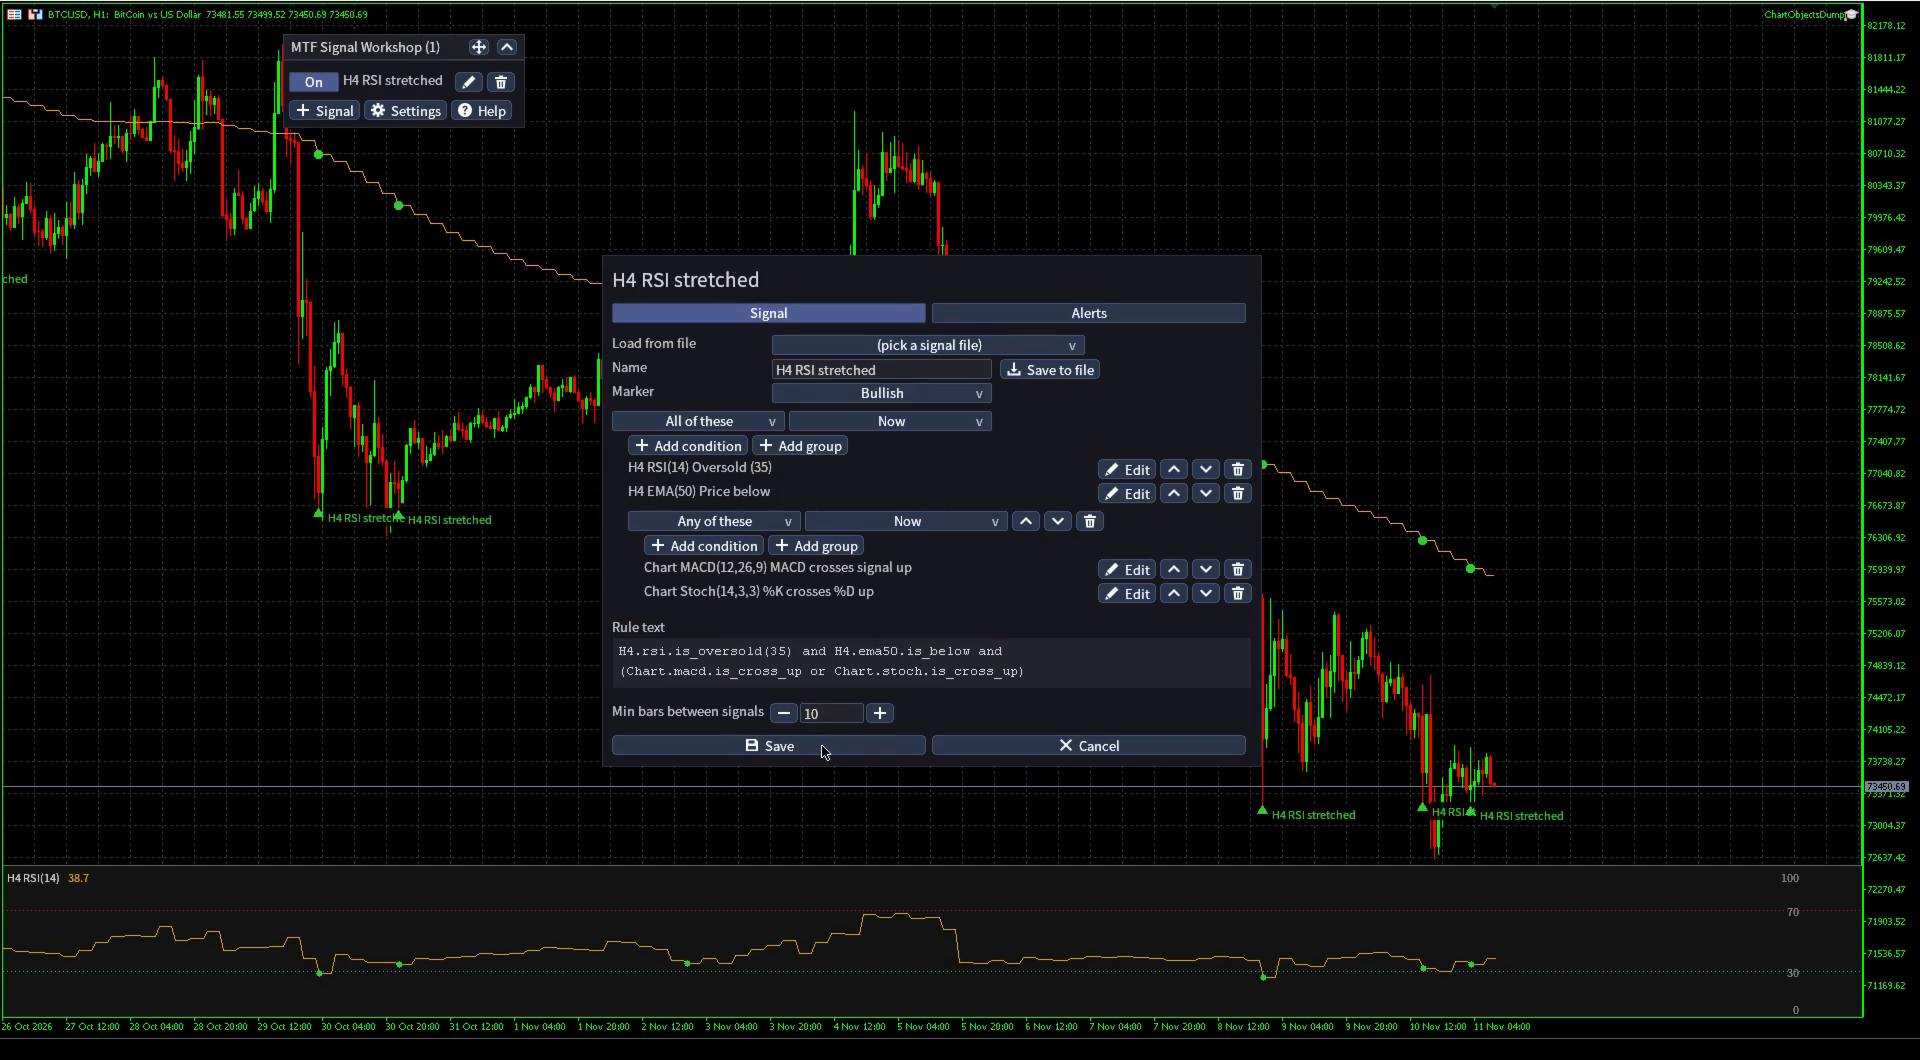
A condition can read the chart’s timeframe with Chart, or keep a fixed timeframe. It can require a flag to be true or false, compare an indicator line with a number or another line of that indicator, and check now, within the last N bars, N bars ago or between two ages. Changing the chart does not silently turn a fixed H4 condition into an M15 one.
The next room has groups, not a bigger pile of checkboxes
“All of these” is only the beginning. A group can match any condition, at least K conditions, or the inverse: not all, none, or fewer than K. Groups nest, and each can have its own time window. You can require a daily trend filter and then accept two of three faster confirmations without pretending those are all the same condition.
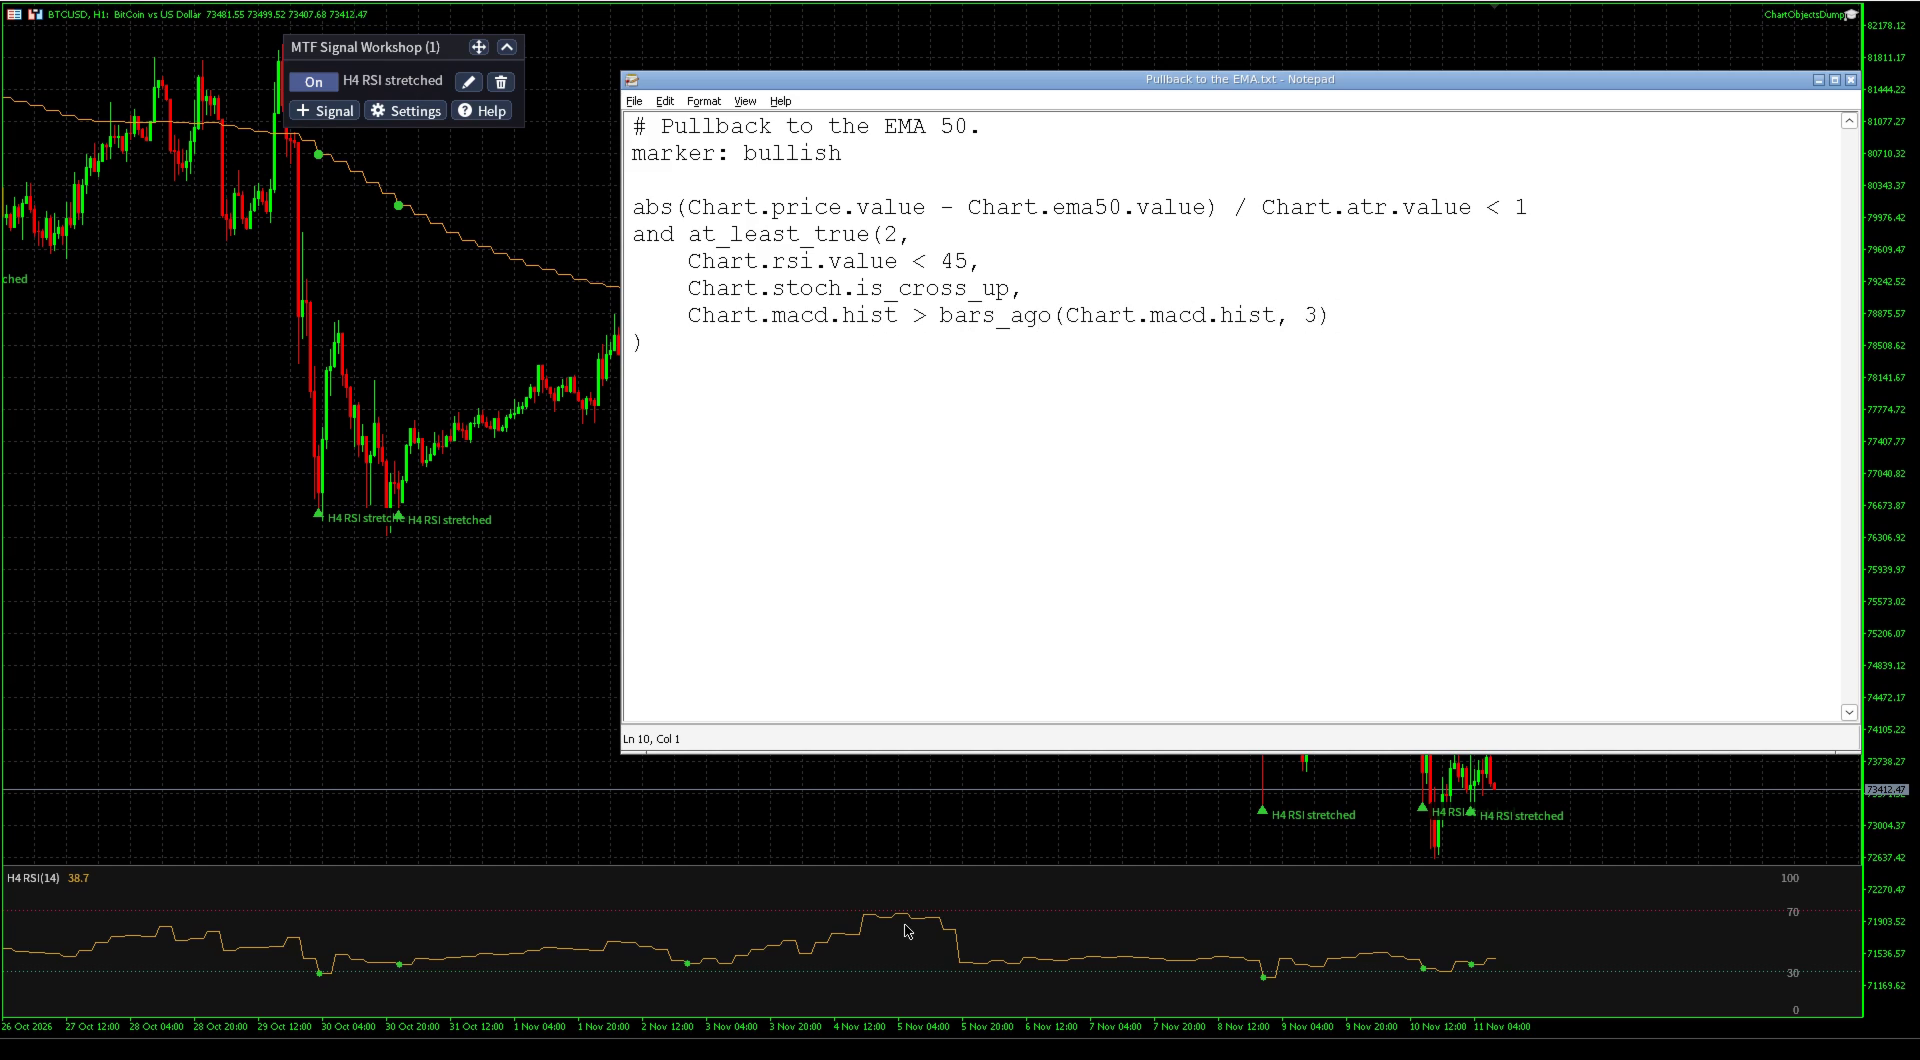
For example, this file rule looks for price within one ATR of its EMA 50 and at least two of three confirmations. The MACD comparison asks whether its histogram improved from three chart bars ago, not merely whether it is positive:
marker: bullish
abs(Chart.price.value - Chart.ema50.value) / Chart.atr.value < 1
and at_least_true(2,
    Chart.rsi.value < 45,
    Chart.stoch.is_cross_up,
    Chart.macd.hist > bars_ago(Chart.macd.hist, 3)
)
The distance is unsigned, so it includes price just below the average too. Add and Chart.ema50.is_above if you specifically want the close to remain above it. That is why showing the expression matters: “pullback” is a description; this is what the program actually tests.
The visual editor handles the condition cards and their groups. More involved arithmetic can be written in the file; a piece the cards cannot construct stays visible as a text card rather than being discarded. A chart edit box holds only 63 characters, so a text editor is the sensible place for long expressions.
Follow the rule into the indicators
The workshop calculates the indicators a signal names and draws them automatically. Overlays sit over price; oscillators use docks below it. Markers only leaves out those indicator plots while keeping the firings and their chart evidence. This is not a loader for arbitrary third-party indicator files. Rules read the workshop’s own catalogue.
- Price and averages: the close, SMA and EMA. A file can request a period from 1 to 1000, rather than being restricted to the common periods offered in the list.
- Bands and trend: Bollinger, Keltner and Donchian channels, Supertrend, Parabolic SAR, Ichimoku and ADX with both directional lines.
- Oscillators: RSI, Stochastic, quad stochastic, Stochastic RSI, MACD, CCI, Williams %R and MFI. Regular and hidden divergence flags are available where documented.
- Structure and zones: swings, BOS and CHoCH, Fibonacci levels, order blocks, fair value gaps, support and resistance, supply and demand. Conditions can read whether price is inside, touching or near a zone, or whether it broke; gaps have filling events.
- Volatility and volume: ATR and tick volume against their averages, plus OBV. Tick volume is what the terminal provides here, not a claim to consolidated exchange volume.
The Trend entry can combine eight methods: structure, MA stack, Donchian, ADX, Supertrend, Parabolic SAR, Ichimoku and VWAP. Switch methods out of the vote, change their parameters, choose the agreement threshold, or use a method’s own flag. A count of agreeing methods is not a probability forecast.
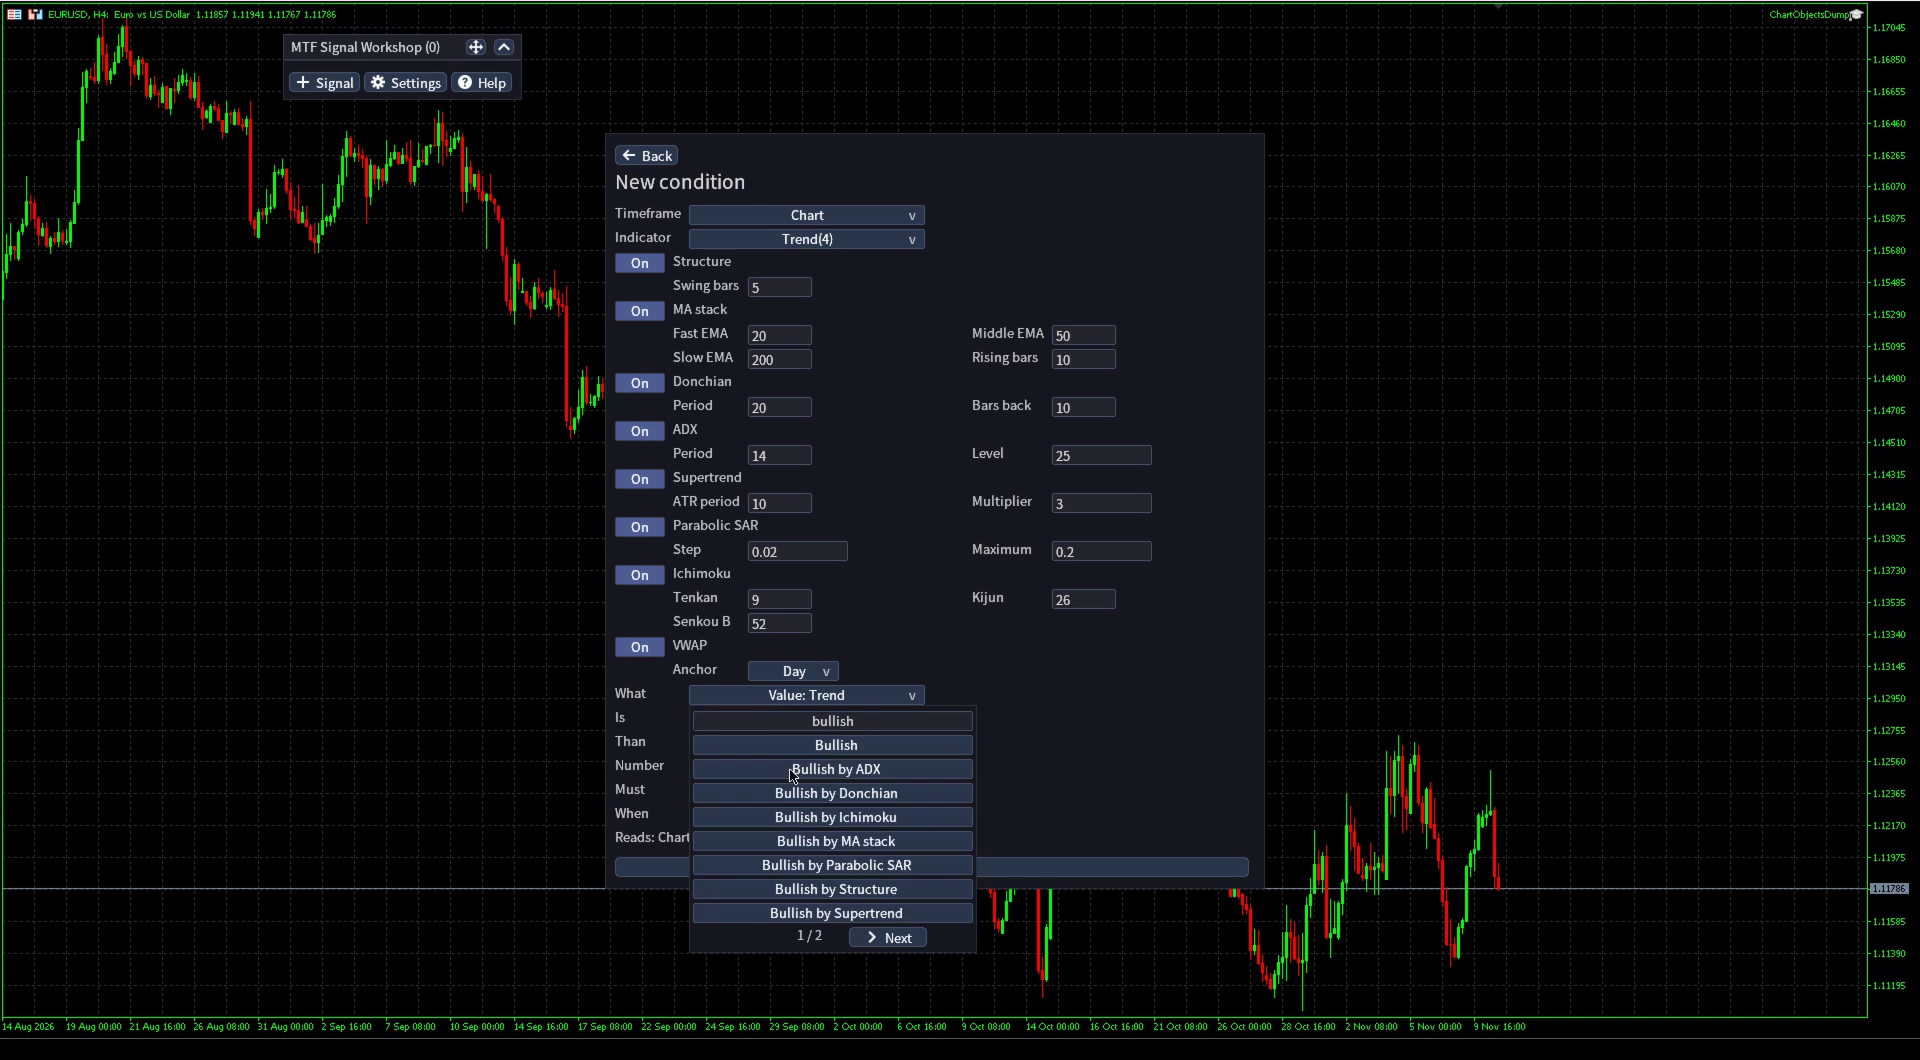
Indicator settings and flag settings are separate. H4.rsi(21).is_oversold(35) means RSI period 21 with an oversold threshold of 35. Leave the period out and RSI uses 14. Leave the threshold out and the oversold flag uses its documented default. The reference lists those numbers, what each flag means and where its definition comes from. You should not need to reverse-engineer a fucking arrow.
Stop at the bar where the condition became known
Every condition reads closed bars of its own timeframe. An H4 value changes when the H4 bar closes, not every time an unfinished candle looks promising on an M15 chart. Historical values are evaluated using what was known then.
A divergence needs the bars after its second pivot before that pivot is confirmed. The marker belongs to the bar where the divergence became known, not the earlier pivot dressed up as a prediction. The chart can draw a line between the pivots without pretending you could have traded the confirmation before it existed.
Flags also differ. Being oversold is a state that can hold across bars; a stochastic cross is an event on one bar. within_bars(H4.stoch.is_cross_up, 3) gives that event a three-H4-bar window. Those are not three bars of whichever chart you happen to be staring at.
Missing history or an indicator still warming up produces an unknown value, not zero. An unknown piece prevents a match, even inside an or or under not. A missing calculation must not turn into a bullish condition by accident.
Each firing has a named arrow and a tooltip listing the conditions. A cross can have a dot at the crossing; a divergence gets its pivot lines; a zone condition gets the relevant box. That makes the marker inspectable. It does not make the underlying trading idea profitable.
The history search defaults to 1000 chart bars and can be changed in the indicator inputs, down to 50. An empty stretch of chart can simply mean the rule did not match within that search, not that its file failed to load.
Leave the screen without turning it into a siren
Settings controls the Alert window, sound, push notifications and email, plus marker colours and a dark or light theme. Push and email still need MetaTrader’s own configuration under Tools, Options, Notifications and Email. The indicator cannot guess your phone’s push ID.
A signal normally follows those shared settings. Turn on Own alerts in its editor to choose its own channels and marker colours. Turn its alert switches off when you only want chart markings. Min bars between signals defaults to 10 and can be changed up to 500, so you control how soon another firing is allowed.
Only a firing on the bar that just closed sends an alert. Historical firings are marked silently, and the last alerted bar is saved so removing and adding the indicator again does not replay the same notification. Loading a thousand bars of history should not sound like your computer is being burgled.
Take the signal with you as a text file
Save puts a signal on the current chart. Save to file writes its reusable definition. To keep a rule for other charts, use Save to file, then Save. Loading a file makes the chart refer to that definition, so editing it updates every chart running it.
Open File, Open Data Folder in MetaTrader. On MT5 the signal files are under MQL5\Files\MTFSignalWorkshop\Signals\; on MT4, under MQL4\Files\MTFSignalWorkshop\Signals\. The Help dialog’s Files page gives the full path. Put a .txt file directly in that directory, not in another directory inside it:
# H4 pullback with a daily trend filter.
marker: bullish
H4.rsi(21).is_oversold(35)
and D1.ema200.is_above
The filename becomes the signal name. Comments start with #; marker: bullish or marker: bearish goes before the rule. Invalid rules show a compilation reason and cannot be saved as if they worked. Change a valid file, save it and the charts using it reload within seconds. Sharing the signal means sending that file, not exporting screenshots of seventeen settings dialogs.
The active list, enabled states, minimum spacing and alert overrides live separately in a per-symbol JSON settings file. Signal set lets you keep different lists for the same symbol or deliberately share one list between charts. The reusable signal files remain common to that terminal’s sets. Removing a shared file pauses the signals that depended on it instead of silently substituting something else.
The tester uses a different door
In the Strategy Tester, select Indicators, choose the workshop, then pick the symbol, timeframe and dates. With no custom settings supplied, it runs six ready-made signals: bullish and bearish versions of DMI crosses with ADX over 25, strong trend agreement and breaks of structure. Indicator chart clicks do not reach the panel there, so prepare custom signals on a normal chart first.
The tester cannot read the terminal’s normal Files directory. Copy the symbol’s settings JSON and the signal files it names into the shared Common\Files directory, preserving their paths. On Windows, this opens the shared location:
%APPDATA%\MetaQuotes\Terminal\Common\FilesFor an example symbol, the copied files would look like this:
Common\Files\
    MTFSignalWorkshop\
        EXAMPLE_SYMBOL.json
        Signals\
            H4 pullback.txt
Use the actual tested symbol’s filename, not EXAMPLE_SYMBOL.json. With a named Signal set, preserve that set’s directory too. The Rules file in Common\Files input can point at another settings file under that shared location. Copy before starting the test, and copy again after changing the chart setup. A portable terminal still uses the shared Common location under AppData.
Where this tour ends
The workshop has no fixed limit on how many signals you define or how long their rules are. Drawing is bounded: 32 indicators per chart and 32 lines over the candles. Structure boxes and labels do not use that line allowance. A signal whose plots do not fit still marks and alerts, and the panel tells you it is drawing markers only. MT4 runs the workshop on its nine timeframes but draws cloud and band boundaries without filled areas; MT5 also supports its extra timeframes.
The Market lists a launch price of 49 USD for the first 10 copies, then 79 USD. Check the relevant listing for the current offer. The free Indicator Suite remains the option when you only want the drawings, without the signal builder or alerts.
I split the full manual into two posts because a first-use walkthrough and a language reference are different jobs. The illustrated user guide covers every panel step, settings files, sharing, alerts, troubleshooting and tester setup. The rule-language and indicator reference defines the syntax, fields, defaults, zone calculations and worked expressions.
This tour ends with a rule you can read, a chart that explains its markers and an alert you chose to receive. It does not end with an order ticket. The workshop watches your conditions; deciding whether those conditions deserve a trade is still your job.
Get Multi Timeframe Signal Workshop for MetaTrader 4 or MetaTrader 5. Start with the user guide, then keep the rule reference beside your chart.